
Executives & ESG
Portfolio-level cost, carbon and intensity trends formatted for board packs and disclosure frameworks.
Decarbonization through data
We turn Niagara 4 histories into actionable financial metrics. Move beyond simple monitoring to automated measurement and verification (M&V) and predictive energy optimisation.
Average emission reduction via automated load shedding.
Typical ROI realised within the first 12 months of deployment.
High-fidelity history collection via native Niagara drivers.
Ready-to-use templates for ISO 50001 and local ESG reporting.
Context first
Standard charts fail because they lack context. We use Project Haystack and Brick Schema within Niagara so every energy point is tagged with its equipment type, location and relationships.
That context is what lets one rule run across a whole portfolio — and what makes every number traceable back to the meter it came from.
Methodology
The method behind every number on your dashboard.
High-fidelity history collection via native Niagara drivers, validated for gaps and sensor drift.
Haystack / Brick semantic tagging gives every point its equipment, location and relationships.
Weather-normalised baselines and rule libraries built per equipment class.
IPMVP-aligned measurement and verification turns kWh into auditable savings claims. IPMVP options explained.
Under the hood
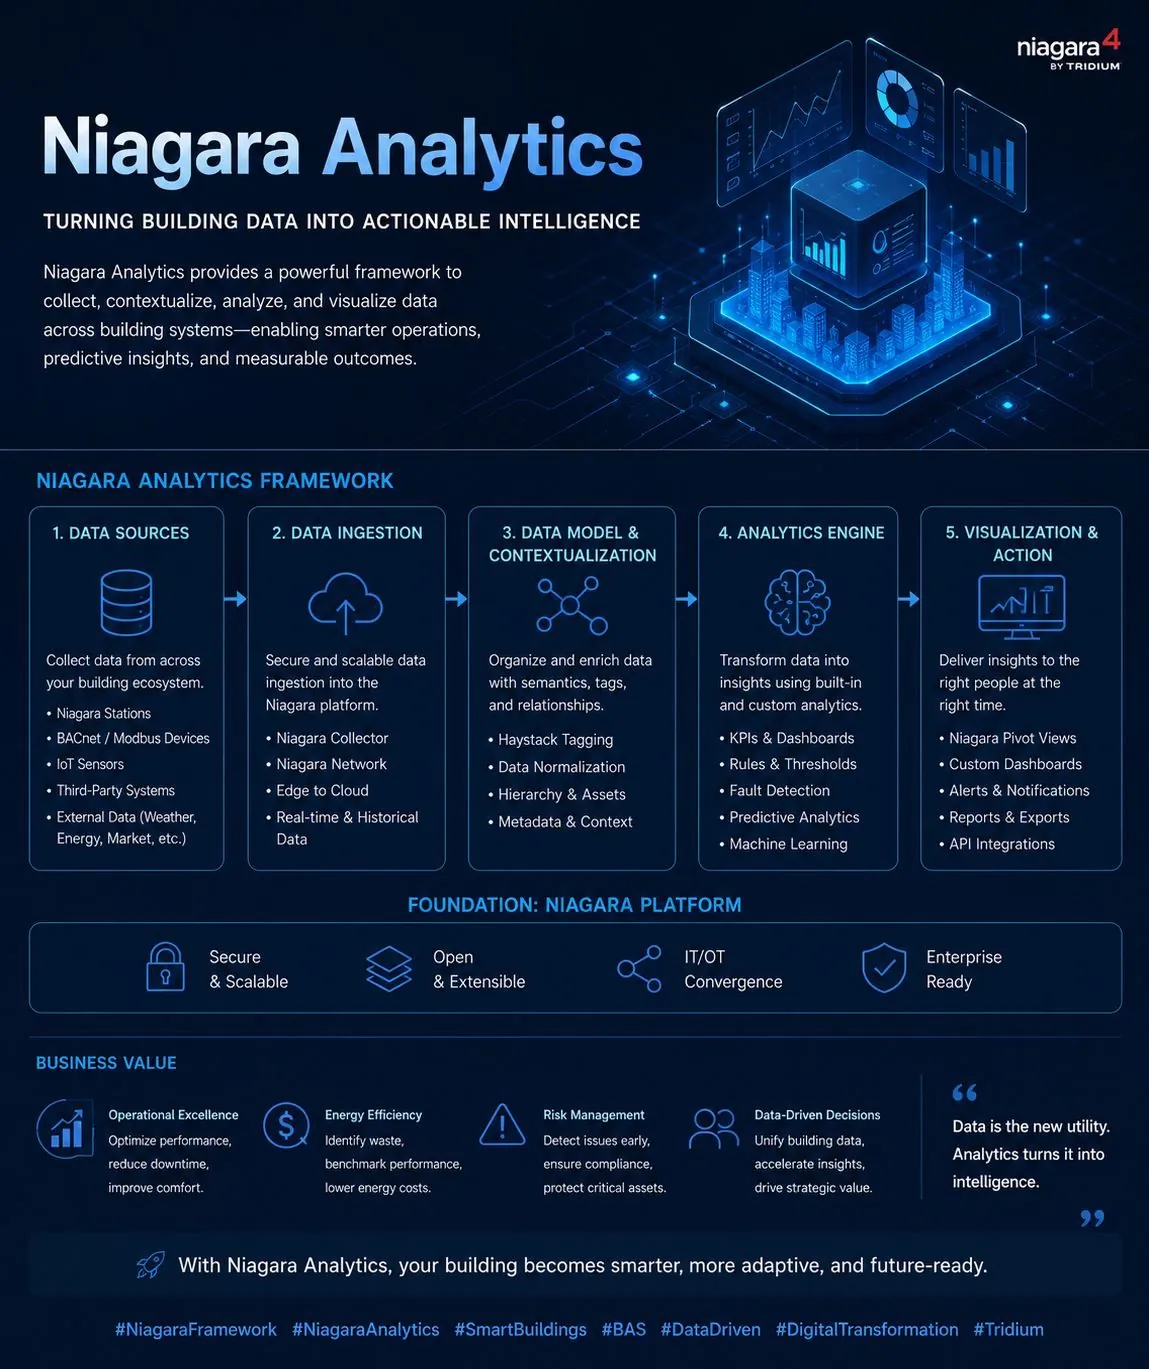
Our analytics work follows the same five-stage pipeline the framework is designed around: collect from every source, ingest securely, contextualise with semantic tags, analyse with rules and models, and deliver insight to the people who can act on it.
Because we engineer stages one to three properly, stages four and five produce numbers you can defend — to auditors, tenants and the board.
Reporting
The same tagged histories feed reports tuned to each audience.
Portfolio-level cost, carbon and intensity trends formatted for board packs and disclosure frameworks.
Equipment-level fault lists, runtime anomalies and efficiency drift, ranked by cost impact.
Sub-metered billing statements and recoverable-cost summaries generated straight from the station.
From data sources to visualisation: the stages every analytics project has to get right.
 Full size
Usually not. We start with the histories your Niagara station already collects. Where coverage gaps genuinely limit insight, we recommend the minimum sub-metering needed and integrate it natively.
Twelve months captures full seasonal behaviour, but useful fault detection and load profiling typically start within weeks of deployment.
Your choice: analytics can run inside the station, on an on-premise Supervisor, or stream to your cloud platform. You retain ownership of all raw and derived data.
Yes — baselines and adjustments follow IPMVP options, with the methodology documented so a third-party verifier can reproduce every number.
The International Performance Measurement and Verification Protocol, published by the Efficiency Valuation Organization — the most widely used framework for measuring energy savings. Our guide explains the four IPMVP options and when each applies.
Energy analytics
How the four IPMVP options work, which one fits your project, and what your Niagara station needs to collect for savings figures that survive an audit.
Service
Custom drivers for legacy, industrial and cloud protocols — engineered, tested and secured.
Explainer
How stations, JACEs and Supervisors fit together — with a glossary of the terms you’ll meet.
Describe your station, protocol or data challenge — an engineer replies within 24 hours.